Content
Essential App Metrics Every Developer Should Track
Understanding the health of your app is crucial for its success. This guide will simplify how to use app analytics effectively, focusing on key performance indicators (KPIs) to enhance user engagement, retention and ultimately, your app’s performance.

App Store / Google Play Store Metrics:
Impressions:
- What It Is: The number of times your app’s icon is viewed on the App Store, indicating the reach of your app.
- Why It Matters: More impressions mean greater visibility, which is the first step in attracting new users. It reflects the effectiveness of your App Store Optimization (ASO) and marketing efforts.
Page Views:
- What It Is: The count of users who click through to your app’s page on the App Store.
- Why It Matters: This metric helps you understand the interest level in your app. A high number of page views in relation to impressions suggests your app icon and name are compelling.
Downloads:
- What It Is: The total number of times your app has been downloaded.
- Why It Matters: Downloads directly indicate your app’s growth and user base size. It’s a fundamental metric for assessing your app’s appeal and reach.
Conversion Rates (Download/Impression and Download/Page Views):
- What It Is: These ratios measure how effectively your app converts viewers into users.
- Conversion rate: (Number of downloads / Number of page views or impressions) * 100
- Why It Matters: Conversion rates help identify how well your Store presence (icon, screenshots, description) convinces potential users to download. Improving conversion means your app appeals more to your target audience.
- AppTweak found that the average conversion rate (CVR) across all categories on the US App Store was 30% in 2023, and 30.5% for US Google Play. More here.
Retention:
- What It Is: The percentage of users who return to your app after the first visit over a specific period.
- Why It Matters: High retention rates indicate user satisfaction and app value. It’s crucial for long-term success, as retaining users is more cost-effective than acquiring new ones. It’s quite normal that only about 25% of individuals who download an app will open it for a second time. You can also check out this benchmark by Apple for more.
Number of Crashes:
- What It Is: The total instances your app fails unexpectedly.
- Why It Matters: Crashes degrade user experience and can lead to negative reviews and high uninstall rates. Minimizing crashes is essential for maintaining a healthy user base.
Number of Uninstalls:
- What It Is: How many users remove your app from their devices.
- Why It Matters: This metric can signal potential problems with your app’s performance, value proposition, or user experience. Analyzing uninstall reasons is key to improving retention.
App Analytics Tool Metrics:
Activation Rate:
- What It Is: The percentage of users who start using the app after downloading it.
- Why It Matters: Surprisingly, a significant number of users download apps but never actually use them. This makes tracking the app’s activation rate essential. A low activation rate may indicate issues with the app’s onboarding process or initial user experience. High activation signifies effective user engagement from the start. If the activation rate falls below 85%, you should consider examining this closely.
Purchase Metrics (Users Making a Purchase, Paywall Conversion Rate):
- What It Is: These metrics assess the effectiveness of your monetization strategies.
- Why It Matters: Understanding how many users are willing to pay and at what point helps in optimizing the app’s revenue model. Tracking conversion rates at the paywall provides insights into pricing and offer attractiveness. An effective paywall conversion rate typically hovers around 1%. Should this percentage decline, it’s crucial to delve into the underlying issues.
Engagement (Daily Active Users - DAU, Monthly Active Users - MAU):
- What It Is: DAU and MAU track how many unique users interact with your app daily and monthly.
- Why It Matters: These metrics give a clear picture of your app’s stickiness and user engagement level. High DAU and MAU indicate a valuable and compelling app experience.
Return on Investment (ROI) for Paid Advertising:
- What It Is: Measures the profitability of your advertising spend.
- Why It Matters: Understanding your ROI helps optimize marketing budgets, ensuring you invest in the most effective channels for user acquisition.
Additional Insights:
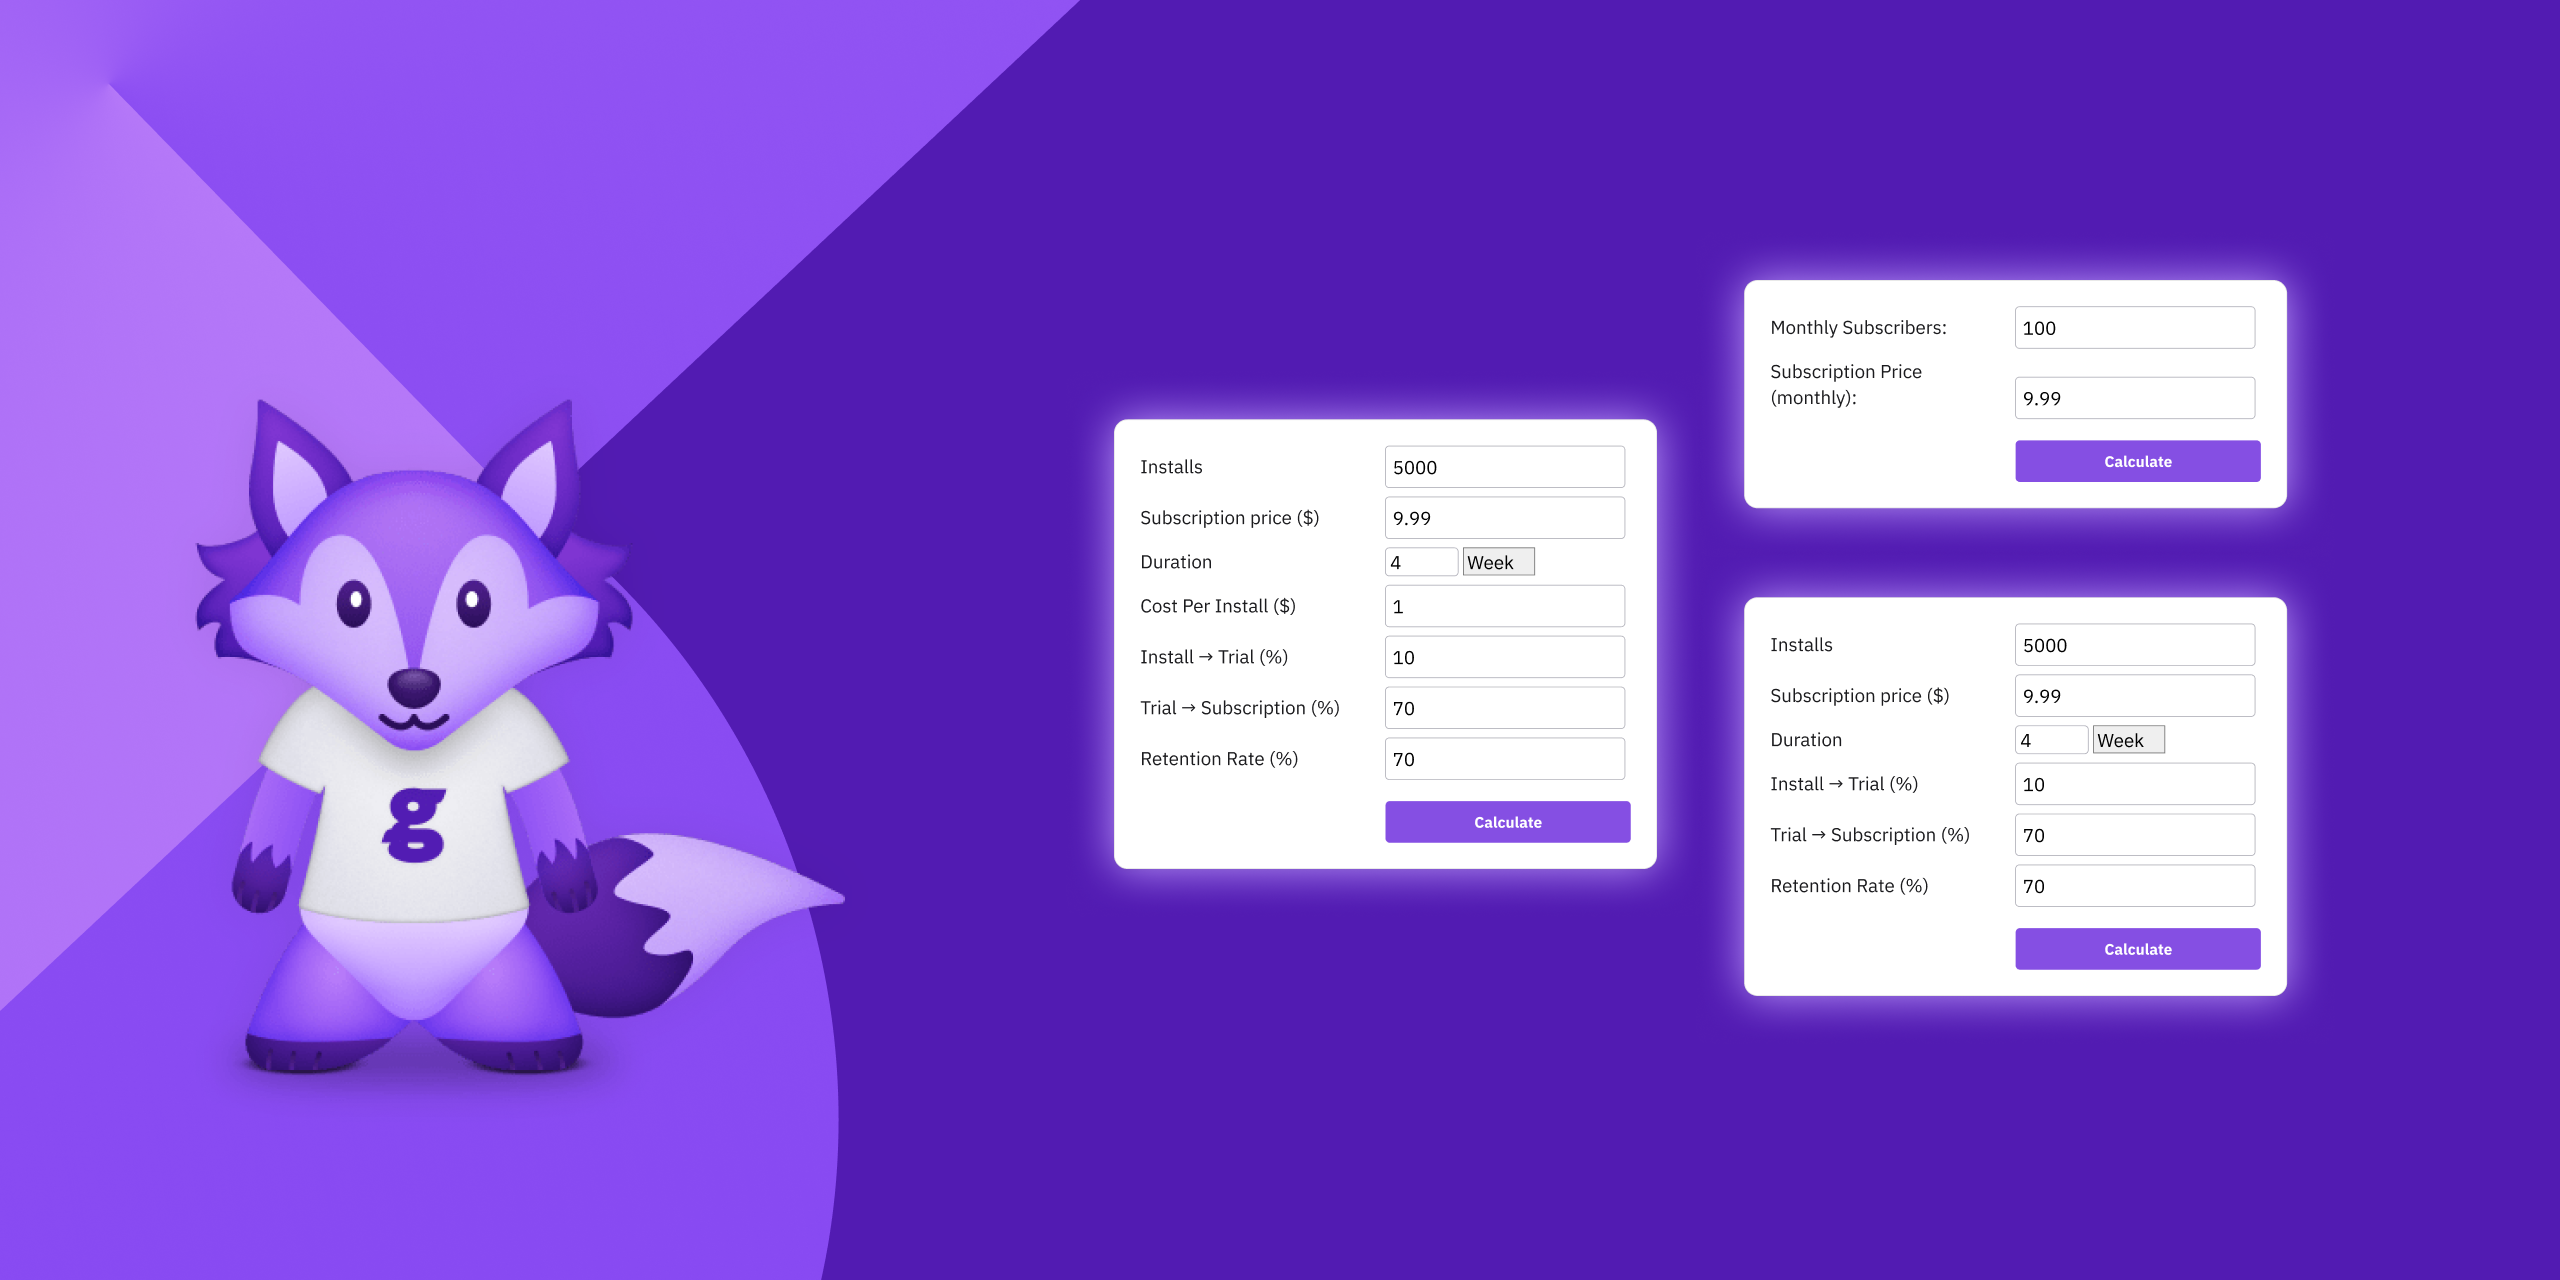
- Benchmarking: Compare your app’s metrics against industry averages to identify areas of strength and opportunities for improvement. Check out the Glassfy Benchmarking Tool here: https://glassfy.io/free-app-revenue-benchmarking-tool/
- User Feedback: Actively seek out and analyze user feedback for qualitative insights that complement your quantitative data.
- Continuous Testing: Regularly A/B test different elements of your app, from marketing messages to features, to optimize performance and user experience.
Tracking these essential app metrics offers a comprehensive view of your app’s performance, guiding you towards strategic improvements. Remember, the goal is not just to attract users but to retain them and ensure a seamless, engaging experience that encourages monetization.
Read More

Maximizing Mobile App Profits: Mastering the ARPU Calculator for Enhanced Revenue Analysis
Last year, app subscription revenues soared to an unprecedented $45.6 billion, up 11.4% from the pre

Monthly Recurring Revenue in Mobile Apps: MRR Calculator
MRR stands for Monthly Recurring Revenue and is the subscription revenue you collect every month fro

The State of Health & Fitness Mobile Apps [2023]
Health and fitness apps are one of the most popular and profitable categories of mobile apps. In 202

