Content
Subscription Metrics: Unlocking Revenue Growth in a Subscription App

Monthly Recurring Revenue (MRR)
Average Revenue Per User (ARPU)
Churn Rate
Trial Conversion Rate
Lifetime Value (LTV)
Welcome to the Master Class on “Metrics for Subscription Success: Unlocking Revenue Growth in a Subscription App Business.” In the fast-paced world of subscription-based services, understanding and effectively utilizing key metrics is paramount to achieving sustainable growth and profitability. This book explores five essential metrics that every subscription business needs to measure and optimize: Monthly Recurring Revenue (MRR), Average Revenue Per User (ARPU), Lifetime Value (LTV), Churn Rate, and Trial Conversion Rate. the Master Class on
Throughout this book, we will delve into each metric, providing in-depth explanations, practical examples, and actionable insights to help you unlock the true potential of your subscription business. From understanding the importance of MRR in tracking recurring revenue to optimizing ARPU to maximize revenue per customer, we will explore the revenue-centric metrics that drive success in the subscription economy.
We will then delve into the metrics that focus on customer retention and acquisition. You will gain a thorough understanding of LTV and its significance in measuring the long-term value of your customer relationships. We will examine churn rate and its implications for customer attrition, user behavior, revenue impact, and retention strategies. Additionally, we will explore trial conversion rate, uncovering its role in evaluating the effectiveness of trial experiences and optimizing conversion strategies.
Throughout the chapters, you will find practical guidance on how these metrics are calculated in Glassfy and how to interpret them. Whether you are a product manager or an indie developer, this book aims to equip you with the knowledge and tools to make data-driven decisions, foster growth, and thrive in the competitive, subscription based companies landscape.
So, let’s dive in and uncover the insights and strategies that will empower you to unlock more revenue growth and drive the success of your subscription business. Get ready to master the metrics that matter and take your subscription business to new heights.
Note: The chapters in this book can be read in any order based on your specific interests or requirements. Feel free to explore the metrics that resonate with your current business needs or read the book cover to cover for a comprehensive understanding of subscription success.
Monthly Recurring Revenue (MRR)
When it comes to Revenue Metrics, the first thing you want to keep an eye on is, of course, Revenue. But while Revenue is a general term for subscription based businesses we can do better and look at Monthly Recurring Revenue (MRR) instead, providing valuable insights into the financial performance and growth potential of your product or service. This article will guide you through the concept of MRR and its significance in tracking revenue in a subscription-based business.
What is MRR?
MRR refers to the predictable and recurring revenue generated from active subscriptions within a specific month. It provides a clear picture of the revenue stream that your subscription business can anticipate on a monthly basis. Tracking MRR allows you to monitor changes in revenue over a time period and assess the health and growth of your customer base.
Calculating MRR
To calculate MRR, we need to sum up the subscription fees from all active subscribers within a given month. This includes revenue from new sign-ups, recurring payments from existing subscribers, and any upgrades or downgrades. It’s important to consider only the recurring portion of the revenue and exclude one-time charges or non-recurring fees. Furthermore, we need to homogenize the subscription revenues from weekly, quarterly, yearly subscriptions or subscriptions of any other length and normalize them to monthly.
MRR Calculation Example
Let’s assume your subscription business has 100 active subscribers paying a monthly fee of $10 each. The MRR calculation would be:
MRR = Number of Subscribers × Average Monthly Subscription Fee
MRR = 100 × $10
MRR = $1,000
Let’s now assume that you also have 100 active subscribers paying a yearly subscription of 90$ and 100 subscribers paying a weekly subscription of 3$.
The MRR calculation would now be:
MRR = Number of monthly Subscribers × Average Monthly Subscription Fee + Number of yearly Subscribers × Average Yearly Subscription Fee / 12 + Number of weekly Subscribers × Average Weekly Subscription Fee × 4
MRR = 100 × $10 + 100 × $90 / 12 + 100 × $3 × 12
MRR = $1,000 + $750 + $1200 = $2950
How it is implemented in Glassfy
The general formula we use in our Glassfy implementation of MRR is the following:
MRR = Sum of [(Subscription Revenue) / (Subscription Duration) * 365 / 12] over all active subscriptions
The MRR chart can be explored at the daily, weekly and monthly level and can be segmented by SKU, country, currency or store and data can be filtered on the same variables.
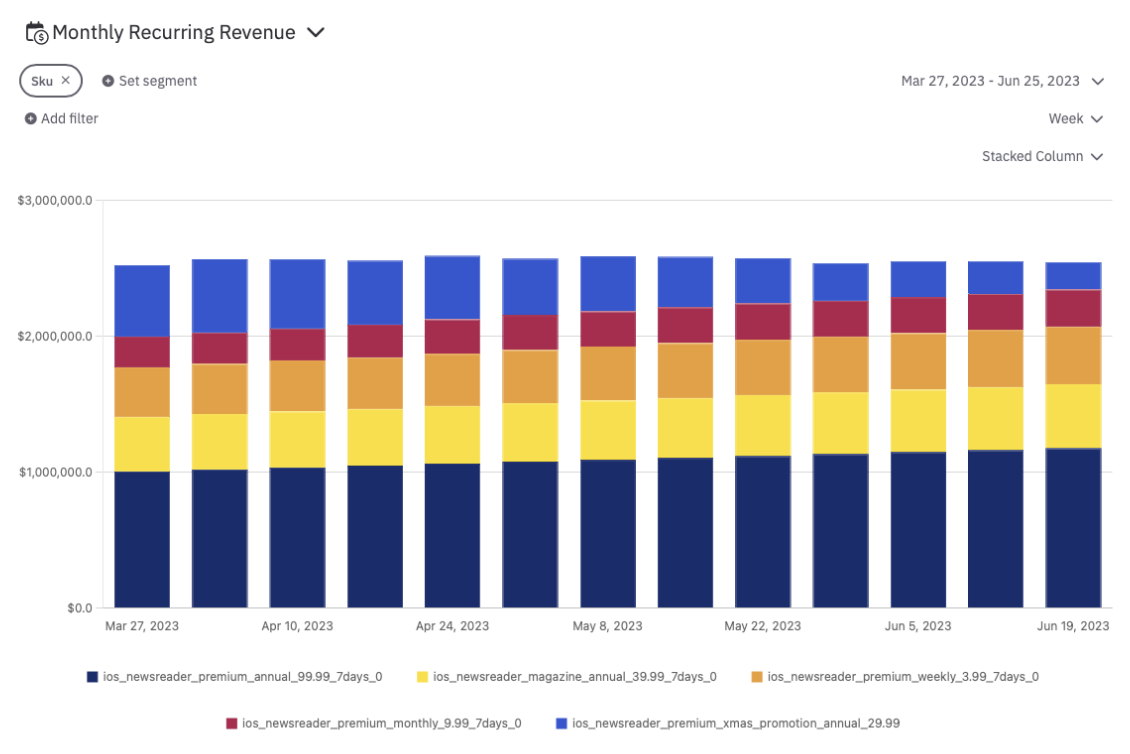
Alongside the actual MRR, we also have a visualization in terms of Annual Recurring Revenue, that might be more relevant for some businesses, but more importantly you can find what we have called MRR movement.
MRR Movement displays the MRR contribution due to new subscriptions, restarted subscriptions and churned subscriptions, and allows the calculation of the Net MRR Movement.
A positive Net MRR Movement indicates that your business is growing week over week
The Importance of Tracking MRR:
Monitoring MRR is crucial for several reasons:
- Revenue Forecasting: MRR provides a predictable revenue stream, allowing you to forecast future revenue and make informed business decisions. By tracking changes in MRR over time, you can identify growth trends, assess the impact of pricing changes, and evaluate the effectiveness of your acquisition and retention strategies.
- Growth Monitoring: MRR serves as a key indicator of your subscription business’s growth trajectory. Analyzing the month-to-month or year-over-year growth in MRR helps you understand the success of your customer acquisition efforts, identify patterns, and spot opportunities for further expansion.
- Subscription Performance Evaluation: MRR allows you to assess the performance of your subscription offerings. By segmenting MRR by subscription plans or tiers, you can identify which plans generate the most revenue and evaluate the effectiveness of pricing and packaging strategies. This information enables you to optimize your product offerings and pricing to maximize revenue potential.
- Customer Retention and Churn Analysis: Monitoring MRR helps you evaluate customer retention and churn rates. By comparing MRR between periods, you can identify revenue lost due to customer cancellations or downgrades. Tracking churn alongside MRR allows you to analyze the impact of customer attrition on revenue and take proactive measures to improve retention and reduce churn.
Average Revenue Per User (ARPU)
In the realm of subscription businesses, understanding the financial performance and revenue generated from individual customers is crucial. Two essential metrics to monitor in this regard are Average Revenue Per User (ARPU) and Average Revenue Per Paying User (ARPPU). This article aims to provide insights into these metrics and their significance in evaluating the monetization potential of your customer base.
What is Average Revenue Per User (ARPU)?
ARPU measures the average revenue generated by each user or customer of your subscription service within a specific period. It provides valuable insights into how effectively you’re monetizing your entire customer base and serves as a benchmark for evaluating the financial performance of your business.
ARPPU specifically focuses on the average revenue generated per paying user, excluding any revenue from free or trial users. It provides insights into the monetization potential of your paying customer base and allows you to evaluate the effectiveness of your pricing strategies and upselling efforts.
Calculating ARPU:
To calculate ARPU, divide the total revenue generated within a specific period by the number of active users or customers during that same period.
ARPU Calculation Example:
Let’s assume your subscription business generated $10,000 in revenue in a month and had 500 active users during that same month.
ARPU = Total Revenue / Number of Active Users
ARPU = $10,000 / 500
ARPU = $20
This revenue is generated only by paying users, a subset of all users. If we assume that only 20% of users are paying:
ARPPU = Total Revenue / Number of Active Paying Users
ARPPU = $10,000 / 100
ARPPU = $100
How it is implemented in Glassfy
In Glassfy we have a single, very versatile, metric that allows us to measure ARPU or ARPPU of the users subscribed during a time interval T at a generic time horizon N.
Specifically:
ARPU N Days = (Total Revenue generated within N days by all users subscribed during time T) / (Number of Users subscribed during time T)
and
ARPPU N Days = (Total Revenue generated within N days by all users subscribed during time T) / (Number of Paying Users subscribed during time T)
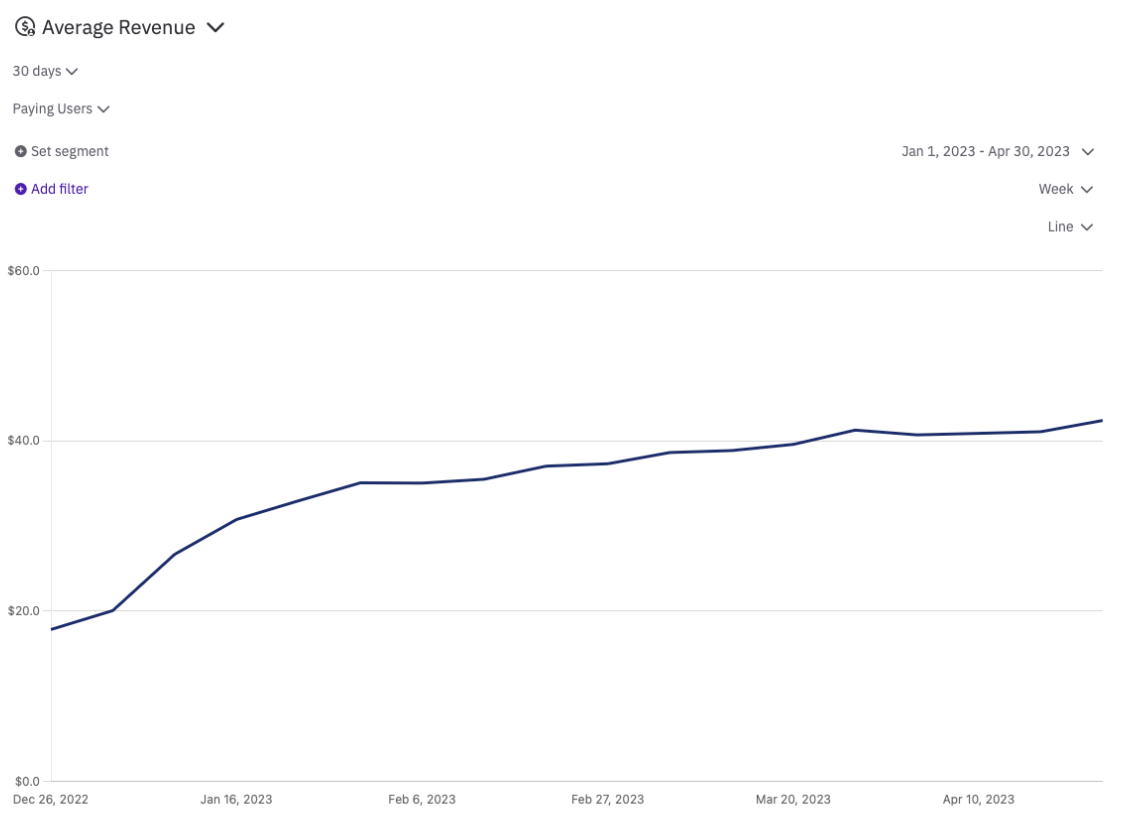
The Average chart can be explored at the daily, weekly and monthly level and can be segmented by SKU, country, currency or store and data can be filtered on the same variables. Furthermore, it is possible to choose the observation horizon among [30 days, 90 days, 6 months, 1 year] and if we want to observe [Paying Users, All Users].
The Importance of Tracking ARPU and ARPPU:
Monitoring ARPU and ARPPU provides several advantages:
- Revenue Optimization: ARPU and ARPPU metrics help you assess the effectiveness of your pricing strategies and monetization efforts. By identifying segments of customers with higher or lower revenue contributions, you can optimize your pricing plans, upselling strategies, and feature offerings to maximize revenue potential.
- Customer Segmentation: Analyzing ARPU and ARPPU allows you to segment your customer base based on revenue contributions. This segmentation helps you identify high-value customers who may require special attention and tailor personalized offerings to maximize their satisfaction and revenue potential.
- Product Strategy Evaluation: ARPU and ARPPU metrics provide insights into the performance of different product tiers, plans, or features. By comparing ARPU and ARPPU across these segments, you can evaluate the impact of pricing changes, upselling strategies, or feature adoption on revenue generation.
- Business Growth and Forecasting: Tracking ARPU and ARPPU over time helps you understand the growth trajectory of your subscription business. By analyzing month-to-month or year-over-year changes, you can identify trends, forecast revenue potential, and make data-driven decisions to foster sustainable growth.
Churn Rate
Churn Rate is a critical metric for subscription businesses as it measures the rate at which customers cancel or unsubscribe from your service over a given period. Understanding and tracking churn rate is essential for evaluating customer retention, identifying areas for improvement, and maintaining the long-term success of your subscription business model. This article aims to provide insights into churn rate and its significance in evaluating customer attrition.
What is Churn Rate?
Churn Rate, also known as customer attrition rate or cancellation rate, represents the percentage of customers who discontinue their subscriptions within a specific period. It provides valuable insights into the health of your customer base and the effectiveness of your retention efforts with current customers.
Calculating Churn Rate
To calculate churn rate, divide the number of customers who churned during a specific period by the total number of customers at the beginning of that period. Multiply the result by 100 to express it as a percentage.
Notice that the specific period over which you calculate the Churn Rate plays a very important role and might lead to misleading interpretations if not taken into account. This means that you cannot directly compare Churn Rates defined on different granularities (say Monthly and Weekly).
Monthly Churn Rate Calculation Example
Let’s say you started the month with 1,000 active subscribers, and during that month, 50 customers canceled their subscriptions.
Monthly Churn Rate = (Number of Churned Customers / Active Subscribers at the Start of the Month) × 100
Monthly Churn Rate = (50 / 1,000) × 100
Monthly Churn Rate = 5%
Weekly Churn Rate Calculation Example
Let’s now consider the first week of the month considered in the previous example, where we have 1000 active subscribers. If we assume that the 50 subscribers churning do so evenly throughout the month, in a week we can assume that about 12 subscribers will churn. The calculation will now be:
Weekly Churn Rate = (Number of Churned Customers / Active Subscribers at the Start of the Period) × 100
Weekly Churn Rate = (12 /1,000) × 100
Weekly Churn Rate = 1.2%
How it is implemented in Glassfy
The general formula we use in our Glassfy implementation of the Churn Rate is the following:
Churn Rate = (number of subscriptions expired during the period) / (number of subscriptions paid at the beginning of the period) * 100
Again, notice that this formula is very general and works with any granularity (day, week, month) but the respective Churn Rates are not easily comparable. We could say, as a rule of thumb, that we expect the weekly Churn Rate to be ¼ of the monthly Churn Rate, and the daily Churn Rate to be 1/7 of the Weekly Churn Rate.
As an example you can see the comparison between weekly and daily churn rates over the last three months.
Alongside the Churn Rate, we also have another metric related to Chur Rate that allows for a more precise analysis, i.e. the Cohort Retention.
Cohort Retention looks at the complement of Chur Rate, i.e. Retention = 1 - Churn. Instead of looking at the average Retention every granularity (month, week or day), we consider cohorts defined with such granularity (for example weekly) and follow them for the following subscription periods (for example months if the subscription is monthly).
For example, let’s assume we use weekly granularity, we define the retention rate after D subscription periods from week T (thus at time T+D):
Retention Rate of cohort T after D periods = (number of subscribers activated in week T that are still active during the period T+D) / (number of subscribers activated in week T) * 100
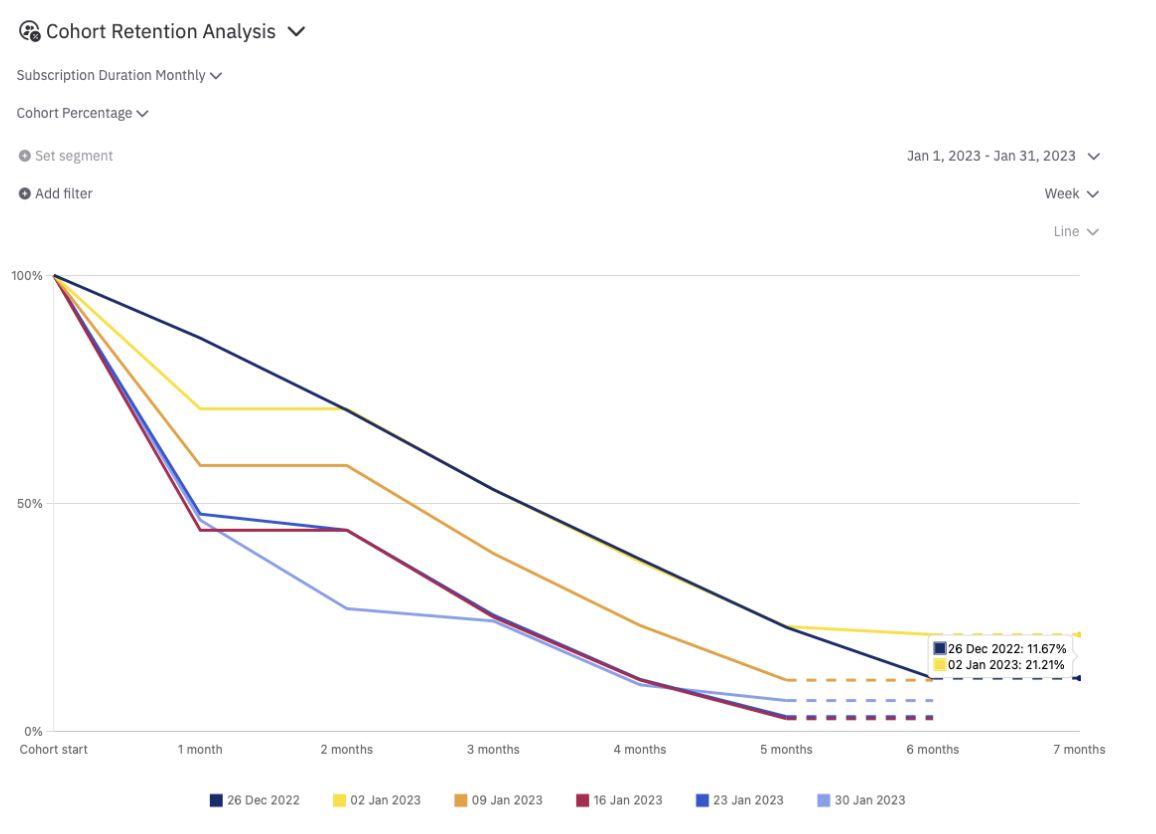
This metric also has an interesting Table View with a color heatmap that facilitates readability.
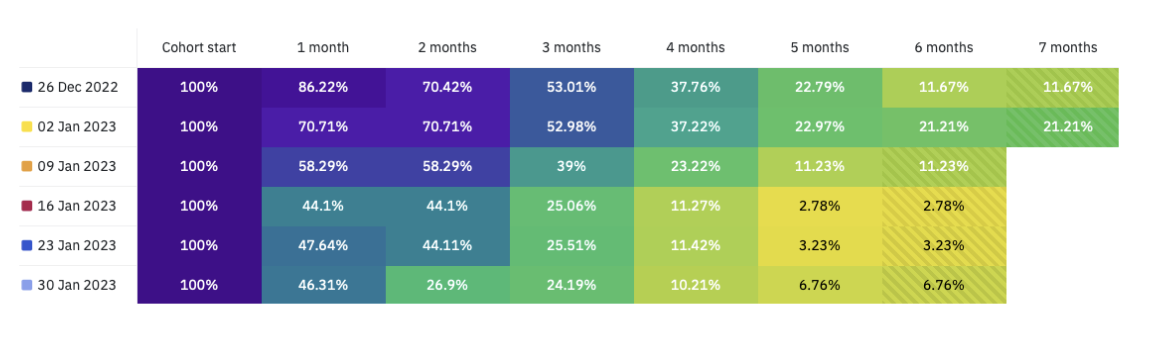
Furthermore, you can also look at this metric in terms of absolute numbers rather than percentages.
The Importance of Tracking Churn Rate or Retention Rate:
Monitoring churn rate provides several advantages:
- Customer Retention Evaluation: Churn rate allows you to assess the effectiveness of your customer retention strategies. By tracking churn rate over time, you can identify patterns, evaluate the impact of changes in your service or pricing, and take proactive measures to improve customer retention.
- Revenue Impact: Churn rate directly affects your subscription business’s revenue. A high churn rate means you are losing customers and the associated recurring revenue. By understanding churn rate and its impact on your revenue, you can prioritize retention efforts, implement strategies to reduce churn, and focus on customer satisfaction and loyalty.
- Identifying Pain Points: Tracking churn rate helps you identify pain points in your customer journey or service offerings. Analyzing the reasons for customer churn can reveal areas that need improvement, such as onboarding processes, product features, customer support, or pricing structures. Addressing these pain points can help reduce churn and improve customer satisfaction.
- Lifetime Value (LTV) Analysis: Churn rate is directly linked to Lifetime Value (LTV). By understanding churn rate alongside LTV, you can assess the impact of customer attrition on revenue potential and make informed decisions to optimize customer acquisition, retention, and monetization strategies.
Trial Conversion Rate
Trial Conversion Rate is a critical metric for subscription businesses that offer trial periods to potential customers. It measures the percentage of trial users who convert into paying customers during the trial period. Understanding and tracking trial conversion rate is essential for evaluating the effectiveness of your trial customer experience throughout, optimizing conversion strategies, and driving revenue growth. This article aims to provide insights into trial conversion rate and its significance in evaluating trial-to-paying customer conversion.
What is the Trial Conversion Rate?
Trial Conversion Rate, also known as trial-to-paid conversion rate, represents the percentage of trial users who become paying customers during the trial period. It measures the success of your trial experience in motivating users to convert into loyal, paying customers.
Calculating the Trial Conversion Rate
To calculate trial conversion rate, divide the number of trial users who convert into paying customers by the total number of trial users. Multiply the result by 100 to express it as a percentage.
Trial Conversion Rate Calculation Example
Let’s assume you had 500 users sign up for a trial period, and out of those, 100 users became paying customers at the end of the free trial period.
Trial Conversion Rate = (Number of Paying Customers from Trial / Total Number of Trial Users) × 100
Trial Conversion Rate = (100 / 500) × 100
Trial Conversion Rate = 20%
How it is implemented in Glassfy
The implementation in Glassfy is pretty straightforward and follows from the previous definition. In Glassfy we have a flag that only activates when a user gets out of a trial period, we don’t need to track the trial starts. This means that our metric also works when we have a mix of trial options with different durations.
In the end is just a simple summation:
Trial Conversion Rate = (number of free trials converted to paid) / (number of trials eligible to convert) * 100.
The Importance of Tracking the Trial Conversion Rate:
Monitoring Trial Conversion Rate is crucial for several reasons:
- Evaluation of Trial Experience: Trial conversion rate helps you assess the effectiveness of your trial experience and onboarding process. By tracking conversion rates over time, you can identify areas for improvement, optimize trial duration, features, pricing, or incentives, and enhance the user experience to drive higher conversion rates.
- Revenue Impact: Trial conversion rate directly impacts your subscription business’s revenue potential. A higher trial conversion rate means more trial users converting into paying customers, resulting in increased recurring revenue. By understanding trial conversion rate and its impact on revenue, you can focus on improving conversion strategies and maximizing revenue growth.
- Identification of Conversion Bottlenecks: Tracking trial conversion rate allows you to identify potential bottlenecks or barriers that prevent trial users from converting into paying customers. Analyzing conversion funnels, user feedback, or engagement patterns can help you pinpoint areas that need improvement, such as the clarity of pricing, trial limitations, or the value proposition during the trial period.
- Conversion Optimization: Trial conversion rate serves as a key metric for optimizing conversion strategies. By conducting A/B testing, experimenting with different trial offers or features, and analyzing the impact on trial conversion rate, you can refine your conversion tactics and drive higher conversion rates.
- Calculation of Customer Acquisition Cost (CAC): even though Glassfy does not currently manage the Customer Acquisition Cost (CAC), one might easily integrate external information with those on Glassfy to estimate this cost. For example if you know the Cost Per Mille (CPM) of your Ad Campaign and the Conversion Rate (CR) of the campaign, i.e. how likely is someone to start a trial after seeing an Ad, you could calculate your CAC as CAC = CPM/1000 * 1/CR * 1/(Trial Conversion Rate).
Lifetime Value (LTV)
Understanding the long-term value that customers bring to your company is essential. The Subscriber Lifetime Value (LTV), is a crucial metric that helps you measure the revenue potential and profitability of your customer relationships. This article aims to provide insights into LTV and its significance in evaluating the financial performance and overall growth, of your subscription business.
What is Lifetime Value (LTV)?
Subscriber Lifetime Value (LTV) is the estimated total value that a customer will bring to your business over their entire relationship with your subscription service. It takes into account the revenue generated by customer lifetime, from their recurring payments, additional purchases, upsells, and cross-sells.
Calculating LTV:
Calculating LTV involves estimating the average revenue generated per subscriber over their entire lifetime.
There are several ways to achieve this calculation, some more elaborate than others. For established businesses, it might be as easy tracking the revenue generated by users subscribed into a specific timeframe and taking the average.
For younger businesses, where there are not so many subscribers that realised their LTV already, one might consider the average churn rate and assume that it stays constant for subsequent periods. For example, after every subscription period the of active subscribers reduces by a certain percentage. You could then sum all there retention rates and multiply them for the price of the subscription.
LTV = Subscription Price * (1 + retention rate + (retention rate)^2 + (retention rate)^3 + …)
LTV Calculation Example 1:
Let’s assume that all the 200 users subscribed in March 2022 generated $10,000 in revenue and that they are no longer generating revenue.
LTV = Total Revenue / Number of Subscriptions started in March 2022
LTV = $10,000 / 200 = $50
Similarly to the difference between ARPPU and ARPU, you could also include subscribers that started a free trial and never converted. In that case you would have a lower LTV representative of the average user that starts using the app.
This revenue is generated only by paying users, a subset of all users. If we assume that only 40% of users are paying:
LTV = Total Revenue / Number of Subscriptions or Trials started in March 2022
LTV = $10,000 / 500 = $20
LTV Calculation Example 2:
Let’s assume that the monthly subscription of your product costs $10 and that every month 20% of the active users churn. You can calculate LTV with the following formula:
LTV = Subscription Price (1 + retention rate + (retention rate)^2 + (retention rate)^3 + …)
LTV = $10 (1 + 80% + (80%)^2 + (80%)^3 + …) = $50
How it is implemented in Glassfy
In Glassfy we have multiple ways to look at Lifetime Value.
The first one does what we described in the first calculation example. It actually is an extension of the ARPU in the metric Average Revenue described in a previous chapter which allows to calculate the ARPU of the users subscribed during a time interval T at a generic time horizon N. In this case the time horizon constraint is lifted and we look to all revenues generated by those users.
Specifically:
LTV = (Total Revenue generated by all users subscribed during time T) / (Number of Users subscribed during time T)
Also for LTV we have the possibility to choose all users or paying users only.
The Average chart can be explored at the daily, weekly and monthly level and can be segmented by SKU, country, currency or store and data can be filtered on the same variables. In this case the observation horizon is set to [Lifetime].
Another interesting metric we implemented is called Time to Realized LTV and it shows you how, on average, LTV is realized over time and when it reaches a threshold at which 95% of it has been realized.
For example, in the picture below you can see that the monthly and weekly subscriptions started in March/April 2022 have realized 95% of their LTV in 35 weeks and the remaining 5% within the following 3-4 months. On the other hand, we can only see the effect of 1 renewal on annual subscriptions, and we see that the retention rate is approximately 25%.
The Importance of Tracking LTV:
Monitoring ARPU and ARPPU provides several advantages:
Monitoring LTV provides several advantages:
- Revenue Maximization: LTV helps you identify high-value customers and tailor strategies to maximize their lifetime value. By understanding which customers contribute the most to your revenue, you can focus on retaining them, encouraging additional purchases, and implementing upselling or cross-selling initiatives.
- Customer Acquisition Strategy Evaluation: By comparing LTV with the cost of customer acquisition (CAC), you can evaluate the effectiveness of your marketing and sales efforts. If LTV exceeds CAC, it indicates a positive return on investment (ROI) for customer acquisition. This insight helps you allocate resources efficiently and refine your acquisition strategies.
- Customer Segmentation: Analyzing LTV allows you to segment your customer base based on their revenue potential. This segmentation enables you to target different customer groups with tailored marketing campaigns, personalized experiences, and offers that align with their lifetime value, fostering higher customer satisfaction and revenue generation.
- Forecasting and Business Planning: LTV provides insights into the long-term revenue potential of your subscription business. By tracking changes in LTV over time, you can identify trends, forecast revenue growth, and make data-driven decisions to support business planning and expansion strategies.
Conclusion
In the ever-evolving world of subscription businesses, tracking key metrics is not only essential but also a strategic advantage. Throughout this book, we have explored five critical metrics that play a pivotal role in driving revenue growth and ensuring companies’ long-term success: Monthly Recurring Revenue (MRR), Average Revenue Per User (ARPU), Churn Rate, Trial Conversion Rate and Lifetime Value (LTV).
Each of these metrics offers unique insights into different aspects of your subscription business, and while they can be valuable on their own, their true power emerges when used together in tandem. By combining the knowledge gained from tracking these metrics, you can gain a comprehensive understanding of your business’s financial health, customer retention, acquisition strategies, and revenue optimization opportunities.
Monthly Recurring Revenue (MRR) provides a foundation for measuring recurring revenue and understanding the revenue-generating potential of your customer base. ARPU dives deeper into individual customer value, helping you optimize pricing, upsell opportunities, and customer segmentation. LTV focuses on the long-term value of customer relationships, enabling you to identify high-value customers, prioritize retention efforts, and make informed decisions regarding customer acquisition and monetization strategies.
Churn Rate sheds light on customer attrition, allowing you to evaluate the effectiveness of your retention strategies, identify pain points, and take proactive measures to reduce churn. Finally, Trial Conversion Rate provides valuable insights into the success of your trial experiences, allowing you to optimize conversion strategies and drive revenue growth from potential new customers.
When these metrics are utilized in tandem, a comprehensive picture of your subscription business emerges. You can evaluate the effectiveness of your marketing and sales efforts by comparing LTV with customer acquisition costs (CAC). You can identify customer segments with the highest LTV and the lowest churn rate, allowing you to tailor your retention strategies and marketing campaigns accordingly. By analyzing trial conversion rates alongside churn rates, you can identify potential bottlenecks in the conversion process and optimize trial experiences to increase customer acquisition.
The true power of these metrics lies in their interconnectedness. By leveraging the insights gained from tracking and analyzing MRR, ARPU, LTV, Churn Rate, and Trial Conversion Rate together, you can make data-driven decisions to drive revenue growth, optimize customer acquisition and retention strategies, and foster long-term success in the competitive subscription landscape.
As you continue your journey in the subscription business realm, remember that tracking and analyzing these metrics is an ongoing process. Regularly monitor and benchmark your performance against industry standards, adapt your strategies based on the changing landscape and customer needs, and continuously seek opportunities for improvement.
So, take what you have learned from this book and apply it to your subscription business. Embrace the power of these metrics, harness monetary value from their insights, and unlock the full potential of your subscription business to thrive in the dynamic subscription economy.
Remember, success in the subscription world is not just about the product or service you offer; it’s about understanding the metrics that matter and leveraging them to drive revenue growth, delight customers, generate revenue, and build a thriving subscription business.
Read More